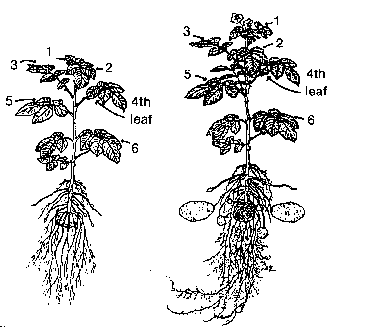
Potato Petiole Sampling and Guidelines
Sampling Techniques

Interpreting the Results
Sufficiency levels of nutrient change over the season, so it is important to evaluate the lab results based on crop stage. Varieties vary greatly in sufficiency levels as well. Below are tables to interpret petiole analysis results.
Nitrates
| Varieties | 60 Days After Planting (ppm) | 70 Days After Planting (ppm) | 90 - 100 Days After Planting (ppm) | 100 to 120 Days After Planting (ppm) |
| Norkotah, Norgold, Yukon Gold, Frontier, Norkotah Texas Lines | High:38,000
Low:28,000 |
High:36,000
Low:25,000 |
High:25,000
Low:15,000 |
High:10,000
Low:5,000 |
| Alpha, Crestone, Century, Centennial, Any New Variety | High:40,000
Low:30,000 |
High:32,000
Low:23,000 |
High:30,000
Low:20,000 |
High:10,000
Low:5,000 |
| Sangre and other Reds | High:35,000
Low:25,000 |
High:20,000
Low:10,000 |
High:15,000
Low:6,000 |
High:0
Low:0 |
| Nugget, Chipeta, Norkotah CO Line 3 | High:32,000
Low:20,000 |
High:25,000
Low:15,000 |
High:14,000
Low:8,000 |
High:6,000
Low:5,000 |
| Russet Burbank | High:30,000
Low:20,000 |
High:28,000
Low:18,000 |
High:25,000
Low:13,000 |
High:10,000
Low:5,000 |
Phosphates
Phosphate sufficiency levels are the same for all varieties more or less and it is a straight line down in levels across the season. The table below summarizes the desirable levels.
| Plant Stage | Desirable Petiole level of Phosphorus in ppm |
| 60 Days After Planting | 3500 |
| 90 days After Planting | 2200 |
| 115 days After Planting | 1000 |
Micronutrients
Again desirable petiole levels don't vary much from variety to variety, but the vary across the growing season. Use the tables below to interpret your petiole lab results.
| MICRONUTRIENT GUIDELINES | |||||
| P % | Ca % | Mg % | S % | Cu ppm | |
| LOW | 0.3 | 0.5 | 0.25 | 0.07 | 2 |
| HIGH | 0.45 | 1.5 | 0.5 | 0.15 | 5 |
| EARLY SEASON PETIOLE REPORT | |||||
| LOW | 0.25 | 0.5 | 0.25 | 0.07 | 2 |
| HIGH | 0.35 | 1.5 | 0.5 | 0.15 | 5 |
| MID SEASON PETIOLE REPORT | |||||
| LOW | 0.1 | 0.5 | 0.25 | 0.07 | 2 |
| HIGH | 0.15 | 1.5 | 0.5 | 0.15 | 5 |
| LATE SEASON PETIOLE REPORT | |||||
| MICRONUTRIENT GUIDELINES | |||||
| K % | Zn ppm | Fe ppm | Mn ppm | B ppm | |
| LOW | 9.5 | 15 | 90 | 30 | 20 |
| HIGH | 12 | 50 | 300 | 100 | 50 |
| EARLY SEASON PETIOLE REPORT | |||||
| LOW | 8.5 | 15 | 60 | 30 | 20 |
| HIGH | 11 | 50 | 300 | 100 | 50 |
| MID SEASON PETIOLE REPORT | |||||
| LOW | 6 | 15 | 40 | 30 | 20 |
| HIGH | 8 | 50 | 300 | 100 | 50 |
| LATE SEASON PETIOLE REPORT | |||||
Note: This information should only be used as a guide. Adjustments for local conditions must always be made.